1. 목적

ㄱ. cpufreq.h 파일을 분석하여 DVFS 관련 정책 함수를 찾아냄


2. 내용

ㄱ. 리눅스 커널 소스 안에 arch/arm/mach-exynos/cpufreq.h 분석

cpufreq_policy_notifier_call  함수가 정책을 변경하는것으로 보임

 *policy에 data를 넣고 코드에 따라서 바뀌는 것으로 보임

int exynos_cpufreq_lock(unsigned int nId, enum cpufreq_level_index cpufreq_level)

함수로 freq 락이 가능할 것 같다.

3. 결론
ㄱ. cpufreq.h 헤더 파일안에 exynos의 주파수 관련 조종 함수들이 있음을 보았고 사용해 보아야 함.


Posted by 시크한공돌이
,

1. 목적

ㄱ. 오드로이드의 주 프로세서인 a9의 PMU driver가 동작하는 알아본다.


2. 내용 

ㄱ. 콘솔에 'dmesg | grep PMU'을 입력하면 관련 메세지가 출력됨


그림 1과 같이 7개의 카운터를 지원한다고 함


그림 1. PMU관련 메세지


3. 결론

ㄱ. PMU 드라이버의 동작을 확인하였고 7개의 카운터가 사용 가능함을 볼 수 있었음.

Posted by 시크한공돌이
,

1. 목적

ㄱ. 리눅스에서 성능 모니터링 권한 관련 부분을 분석해 본다.

ㄴ. 권한 분석 후 SW와 HW 모니터링을 카운터 해본다.


2. 내용

ㄱ. 리눅스에서 커널 모니터링 권한

/proc/sys/kernel/perf_event_paranoid <- 모니터링 권한을 가지고 있음

proc은 램디크크 이므로 시동시 초기화됨(커널 수정을 통한 값 변경이나 모듈 실행시 변환 요함)


cat으로 열어보면 권한 표시 / 권한은 아래와 같음

- kernel.perf_event_paranoid = 2: you can't take any measurements. The perf utility might still be useful to analyse existing records with perf ls, perf report, perf timechart or perf trace.

- kernel.perf_event_paranoid = 1: you can trace a command with perf stat or perf record, and get kernel profiling data.

- kernel.perf_event_paranoid = 0: you can trace a command with perf stat or perf record, and get CPU event data.

- kernel.perf_event_paranoid = -1: you get raw access to kernel tracepoints (specifically, you can mmap the file created by perf_event_open, I don't know what the implications are).

perf_event_paranoid gets 2

그림 1. paranoid 확인과 설정
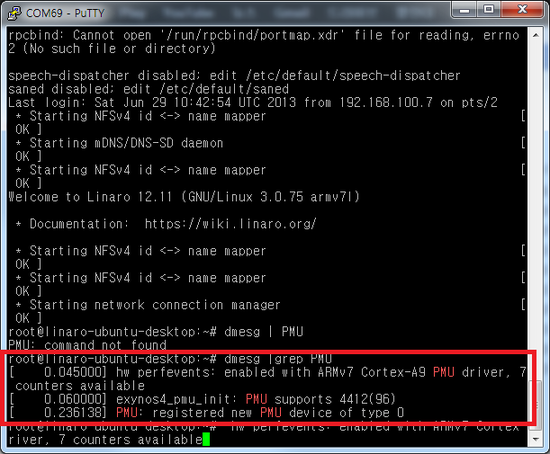


확인 후 카운터 샘플 돌려본 결과

그림 2와 같이 SW는 여전히 카운팅 되지만 HW는 안됨
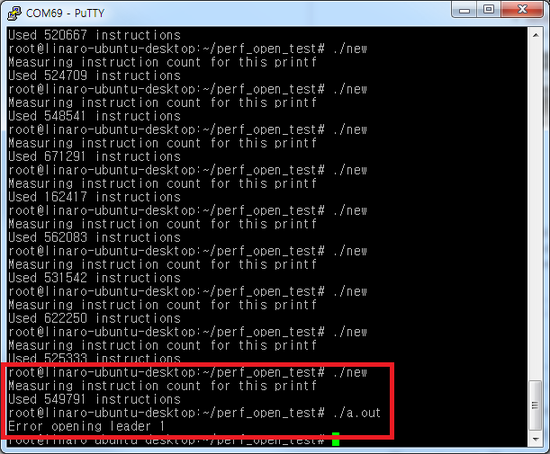
 

그림 2. SW, HW 카운트 샘플

참조  : http://wrightsolutions.wordpress.com/category/virtualisation/virtualbox/

http://unix.stackexchange.com/questions/14227/do-i-need-root-admin-permissions-to-run-userspace-perf-tool-perf-events-ar


3. 결론

ㄱ. 권한을 담당하는 램디스크 상주 파일을 분석하여 이벤트 모니터링에 대한 권한을 설정하여 보았다.

ㄴ. 권한을 proc 상에서 변경하여 카운팅 해본 결과 SW 성능 이벤트는 카운팅 되었지만 HW 성능 이벤트는 카운팅 하지 못하였다.

Posted by 시크한공돌이
,

1. 목적 

ㄱ. odroid x2 타깃으로 DVFS 및 performance monitering을 하기위해 cpufreq.h, perf_event.h를 분석한다. 


2. 내용 

ㄱ. 먼저  리눅스 커널/include/linux/perf_event.h의 분석


파일 중간에 sample관련 함수부가 나옴 참조 (1012 줄)

그림 1. perf_event.h속의 perf_output_sample 및 관련 함수부

 그림1을 참고하면 흔히 커널 모듈 프로그램에서 볼 수 있는 값 반환 형식이 아닌 struct 포인터로 값을 지정하고 주고 받는것으로 보임

perf_output_handle의 stuct는 아래와 그림 2와 같음.

그림 2. perf_output_handle의 strucure

 그림 2 하단을 보면 perf_output_handle의 구조가 보이는데 이중 event와 buffer, void 형 포인터인 addr을 주목해야 할 것으로 보임.

(perf_buffer 구조형 *buffer와 void형 *addr 중 하나가 데이터를 받을 것으로 추정 - 후에 코멘트 업데이트 예정)


Posted by 시크한공돌이
,